
Analysis and dashboards
Analysis that answers the question that was asked, and dashboards people use: clear indicators, honest denominators and nothing decorative.
IncludesPower BI, R and SQL, automated reporting, indicator design
Data professional · Trainer · Author
I’m Oluwatobi Olatunbosun. For over a decade I have worked in data management, monitoring and evaluation, analytics and decision support, and trained the people who do this work. Here I share the methods, tools and judgement behind it.

10+years working
with data
I help organisations and teams make better decisions with their data, and I train the people who do the work.
Analysis that answers the question that was asked, and dashboards people use: clear indicators, honest denominators and nothing decorative.
IncludesPower BI, R and SQL, automated reporting, indicator design
Data management, data quality and monitoring and evaluation systems that take teams from static reports to continuous monitoring.
IncludesData quality reviews, indicator tracking, M&E frameworks
Hands-on courses and mentoring for analysts, M&E staff and whole teams, from the first spreadsheet to production dashboards.
SubjectsData analytics, SQL, data science, MERL, GIS, research methods
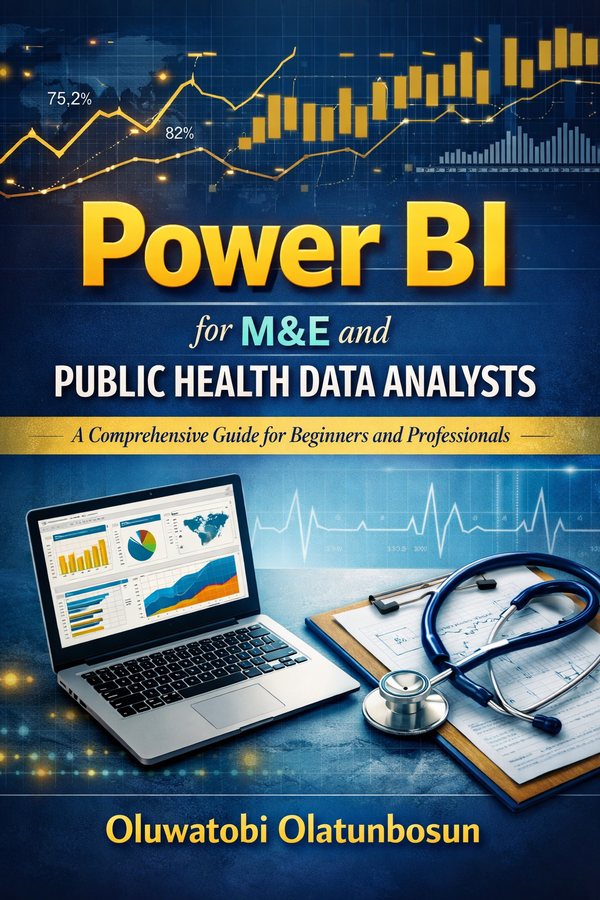
A hands-on guide I wrote for people who work with health programme data: HIV, TB, malaria, ANC and NCD indicators, with a practice dataset that is messy on purpose.
Free, in your browser, and nothing you enter leaves your computer.
Drop in a CSV file and see what needs fixing before you analyse it: duplicate rows, missing values written as text, labels spelled several ways, mixed date formats and placeholder dates.
Check a filePick a layout for the situation you are in, drag it into shape, and export a background for Power BI or Excel.
Open the generatorNew lessons, tools and resources by email. Subscribers also get my free Power BI book.