Chapter: 4 Connecting to Common Data Sources
Power BI Desktop can connect to hundreds of data sources, but most Monitoring and Evaluation and public health work relies on a small, predictable set: files exported from information systems, and the systems themselves (DHIS2, KoboToolbox, ODK Central).
Get data on the Home tab is always the starting point. Effective use of Power BI is less about knowing every connector and more about knowing which connector to use, and what it will do to your data.
In this chapter you will load the book’s sample data, then see how the same approach applies to DHIS2, KoboToolbox and ODK Central.
4.1 Before You Begin: The Sample Dataset
All exercises use a synthetic, patient-level integrated health dataset covering antenatal care (ANC), HIV and ART, malaria, tuberculosis (TB) and non-communicable diseases (NCDs).
No real patient data is used.
4.1.1 Files included
Download the following CSV files from the Data Dictionary and Access appendix:
fact_patient_visits.csvfact_targets.csvdim_patient.csvdim_facility.csvdim_date.csv
These files are intentionally not clean. They contain data-quality problems similar to those in real health information systems, which you will find and fix in Chapter 5. For now, focus only on connecting the data successfully.
4.2 File-Based Data Sources
File exports are the most common entry point for M&E professionals, and it is how we begin.
4.2.1 Practical Exercise 4.1: Import the Fact Table
Objective: Connect Power BI to the main patient-level fact table.
Steps:
- Open Power BI Desktop.
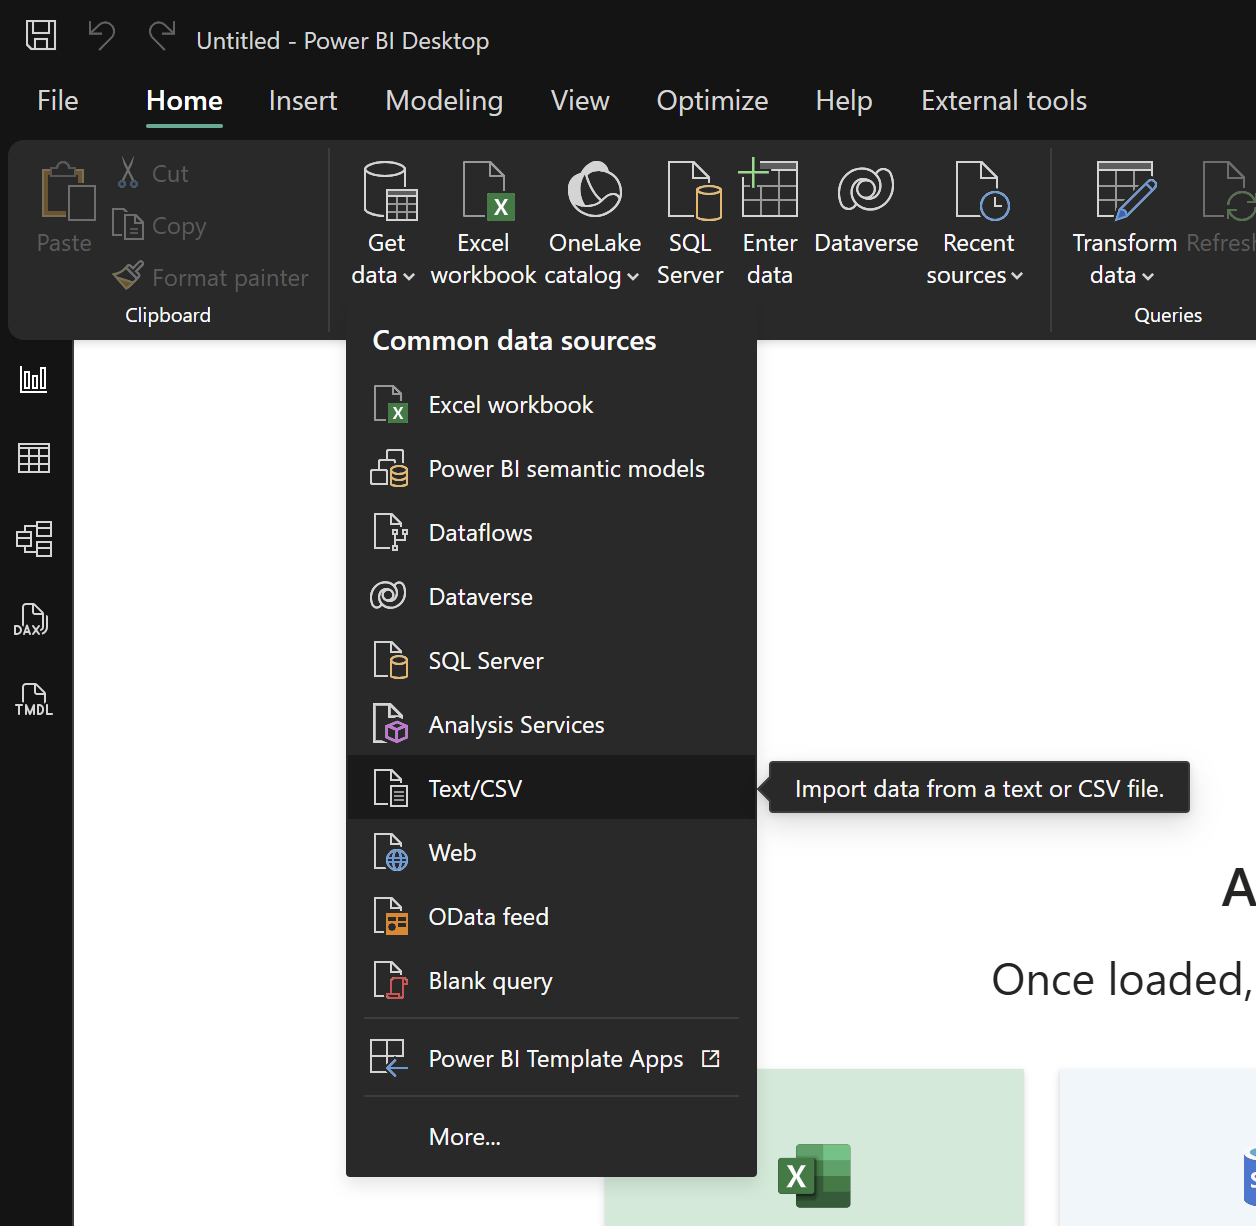
- Select Get data → Text/CSV.
- Select
fact_patient_visits.csvand select Open. - Review the preview window. Note the three settings at the top: File Origin, Delimiter, and Data Type Detection. You will come back to the first and last of these in Chapter 5.
- Select Load.
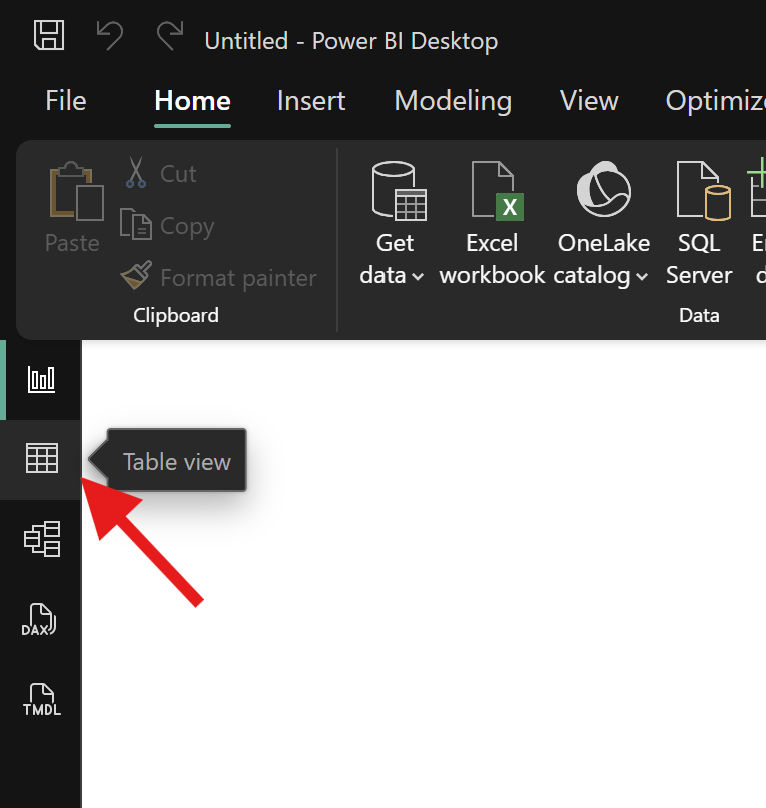
To view the imported data, select the Table view icon on the left sidebar.
What to observe:
- The
anc_visitcolumn contains more than two versions of “Yes”. - Missing values appear as the text
NA. - Some
tb_test_datevalues use a different format from the others.
Do not fix anything yet. That is the job of the next chapter.
4.2.2 Practical Exercise 4.2: Import the Other Tables
Repeat the steps for:
dim_patient.csvdim_facility.csvdim_date.csvfact_targets.csv
You should now have five tables loaded into Power BI.
Reflection:
- Which tables contain one row per thing (patient, facility, day)?
- Which table contains repeated events?
- Which columns appear in more than one table and could connect them?
These questions become important in Chapter 6.
4.2.3 Why CSV?
DHIS2, KoboToolbox and ODK Central can all export CSV. CSV is simple and portable, but it carries no information about data types. Every value arrives as text, and Power BI has to guess what each column contains. Chapter 5 shows how to control that guess.
4.3 The Folder Connector
In routine reporting, data often arrives as a series of files with the same structure: monthly extracts, quarterly submissions, one file per facility.
The Folder connector combines all files in a folder and applies the same steps to each. When next month’s file is added to the folder, a refresh picks it up automatically.
4.3.1 Practical Exercise 4.3: Combine Files from a Folder (Optional)
Setup:
- Create a new folder.
- Copy
fact_patient_visits.csvinto it twice, and rename the copiesvisits_part1.csvandvisits_part2.csv.
Steps:
- Select Get data → Folder (under All, or search for “Folder”).
- Browse to the folder and select Open.
- Select Combine & Transform Data, then OK.
Reflection:
- The combined table has twice as many rows (20,060), because both files are identical. In real use, each file would hold a different month.
- Power BI adds a
Source.Namecolumn so you can see which file each row came from. - Power BI creates helper queries in a group. Every step you add to the sample file is applied to all files.
We don’t use this method for the main exercises, but it is the standard pattern for monthly exports.
4.4 Connecting to M&E Platforms
The same pattern (connect, then clean in Power Query) applies when you connect directly to the systems your programme uses. Connecting directly means a refresh brings in new data without anyone exporting files.
Three rules apply to all of them:
- Use an account with the minimum access needed, ideally a dedicated read-only account for reporting, not your personal administrator account. The data Power BI receives is limited by what that account is allowed to see.
- Credentials are stored in Power BI, not in the file you share. You re-enter them on another computer, and again in the Power BI service for scheduled refresh (Chapter 9).
- If the system is on an internal network, the Power BI service needs an on-premises data gateway to refresh it. Systems reachable over the internet usually don’t.
4.4.1 DHIS2
Microsoft’s list of Power Query connectors (checked October 2026) has no DHIS2 connector, and none for KoboToolbox or ODK either. Instead, use the Web connector with the DHIS2 Web API, which can return aggregated data directly as CSV through its analytics endpoint. A request has this shape:
https://<your-dhis2-server>/api/analytics.csv
    ?dimension=dx:<indicator or data element ID>
    &dimension=pe:LAST_12_MONTHS
    &dimension=ou:<organisation unit ID>
    &outputIdScheme=NAME
(Write it as one line, without spaces or line breaks.)
-
dxis the data (indicators or data elements),pethe period, andouthe organisation unit. Separate several IDs with a semicolon. -
peaccepts relative periods such asLAST_12_MONTHS, so the same URL returns up-to-date data at every refresh. -
outputIdScheme=NAMEreturns names instead of internal IDs.
We tested this format against DHIS2’s public demonstration server
(version 2.43.2) in October 2026. With ou as a dimension, the CSV has
the columns Data, Period, Organisation unit and Value. The
demonstration account was only allowed to view data for one health post,
and requests for other areas were refused. DHIS2 applies the user’s
access rights to API requests too.
To connect from Power BI:
- Select Get data → Web.
- Paste the URL and select OK.
- Select Basic, enter the DHIS2 username and password of your reporting account, and select Connect.
DHIS2 also supports personal access tokens, which its documentation recommends over username and password for scripts and apps. Ask your DHIS2 administrator which method your organisation allows.
To find IDs, open the item in DHIS2 (for example, in the Maintenance app) or ask your DHIS2 administrator. The output is a tall table, one row per data item, period and organisation unit: ready for the model.
4.4.2 KoboToolbox
KoboToolbox’s documentation describes connecting to Power BI through a synchronous export: a URL that returns your project’s data as a CSV or XLSX file using export settings you define.
- Get the synchronous export URL for your project through the KoboToolbox API (the KoboToolbox guide Using the API for synchronous exports walks through this).
- In Power BI, select Get data → Web, paste the URL, and select OK.
- Select Basic, enter your KoboToolbox username and password, and select Connect.
KoboToolbox notes that synchronous exports are updated every 5 minutes, and that an export must complete within 120 seconds, so very large projects may fail. Repeat the process for each project and relate the resulting tables in the model.
4.4.3 ODK Central
ODK Central publishes form submissions as an OData feed, and its documentation gives these steps for Power BI:
- In ODK Central, open the form’s Submissions page and select Analyze via OData to copy the feed link.
- In Power BI, select Get data → OData feed.
- Leave the feed type as Basic, paste the link, and select OK.
- Change the authentication type to Basic (not Anonymous), enter your ODK Central email address and password, and select Connect.
- Select Submissions, then Load (or Transform Data to clean it first).
Because OData carries data types and the feed is live, a refresh brings in new submissions as they arrive.
4.4.4 Electronic medical records (FHIR)
Many electronic medical record systems can expose data through FHIR, the HL7 standard for exchanging health data. Power BI has a FHIR connector (listed under Get data). You can use it only if your EMR’s FHIR server and the permissions your organisation grants allow it. Patient-level clinical data needs particular care with access and privacy.
4.5 Connection Modes: Import and DirectQuery
When you load data, Power BI uses Import mode by default.
Import copies the data into the Power BI model. Visuals respond quickly, and all features are available. The data is as current as the last refresh. This is the right choice for almost all M&E reporting, including everything in this book.
DirectQuery leaves the data in the source system and sends a query every time a visual is used. It is only available for some sources, such as databases, and it limits what you can do in Power Query and DAX. Consider it only when data must be up to the minute or is too large to import, and with support from whoever manages the source system.
Rule of thumb: If you are learning, or unsure, use Import.
4.6 Practice Summary
By the end of this chapter, you should have:
- loaded all five sample tables,
- noticed some of their data-quality problems without fixing them,
- seen how the same Get data pattern applies to DHIS2, KoboToolbox and ODK Central.
At this stage, the data may look messy. That is expected.
The next chapter focuses on cleaning and transforming data with Power Query, where we will systematically fix these issues.
Power BI for M&E and Public Health Data Analysts · The Growing Analyst