Chapter: 3 Understanding the Power BI Ecosystem
Power BI isn’t a single program. It is a collection of tools, each designed for a specific role in the data life cycle.
Many frustrations with Power BI come from not understanding this
separation: analysts emailing .pbix files from Desktop, stakeholders
expecting to edit reports in the browser, or teams discovering at the
last minute that their data can’t be refreshed without a gateway.
This chapter gives you a clear mental model of how the parts fit together in M&E and public health work. At a high level, the ecosystem separates:
- Building (Power BI Desktop)
- Sharing and refreshing (the Power BI service)
- Consuming (browser and mobile apps)
Product details in this chapter were checked against Microsoft’s documentation in October 2026.
3.1 Power BI Desktop (The Kitchen)
Power BI Desktop is a free Windows application where the technical work happens.
- Used for: connecting to data, cleaning it in Power Query, building the model, writing DAX, and designing report pages.
- Used by: analysts, M&E officers, data managers.
Think of Desktop as the kitchen: ingredients are prepared and recipes tested here. It is not where the meal is served.
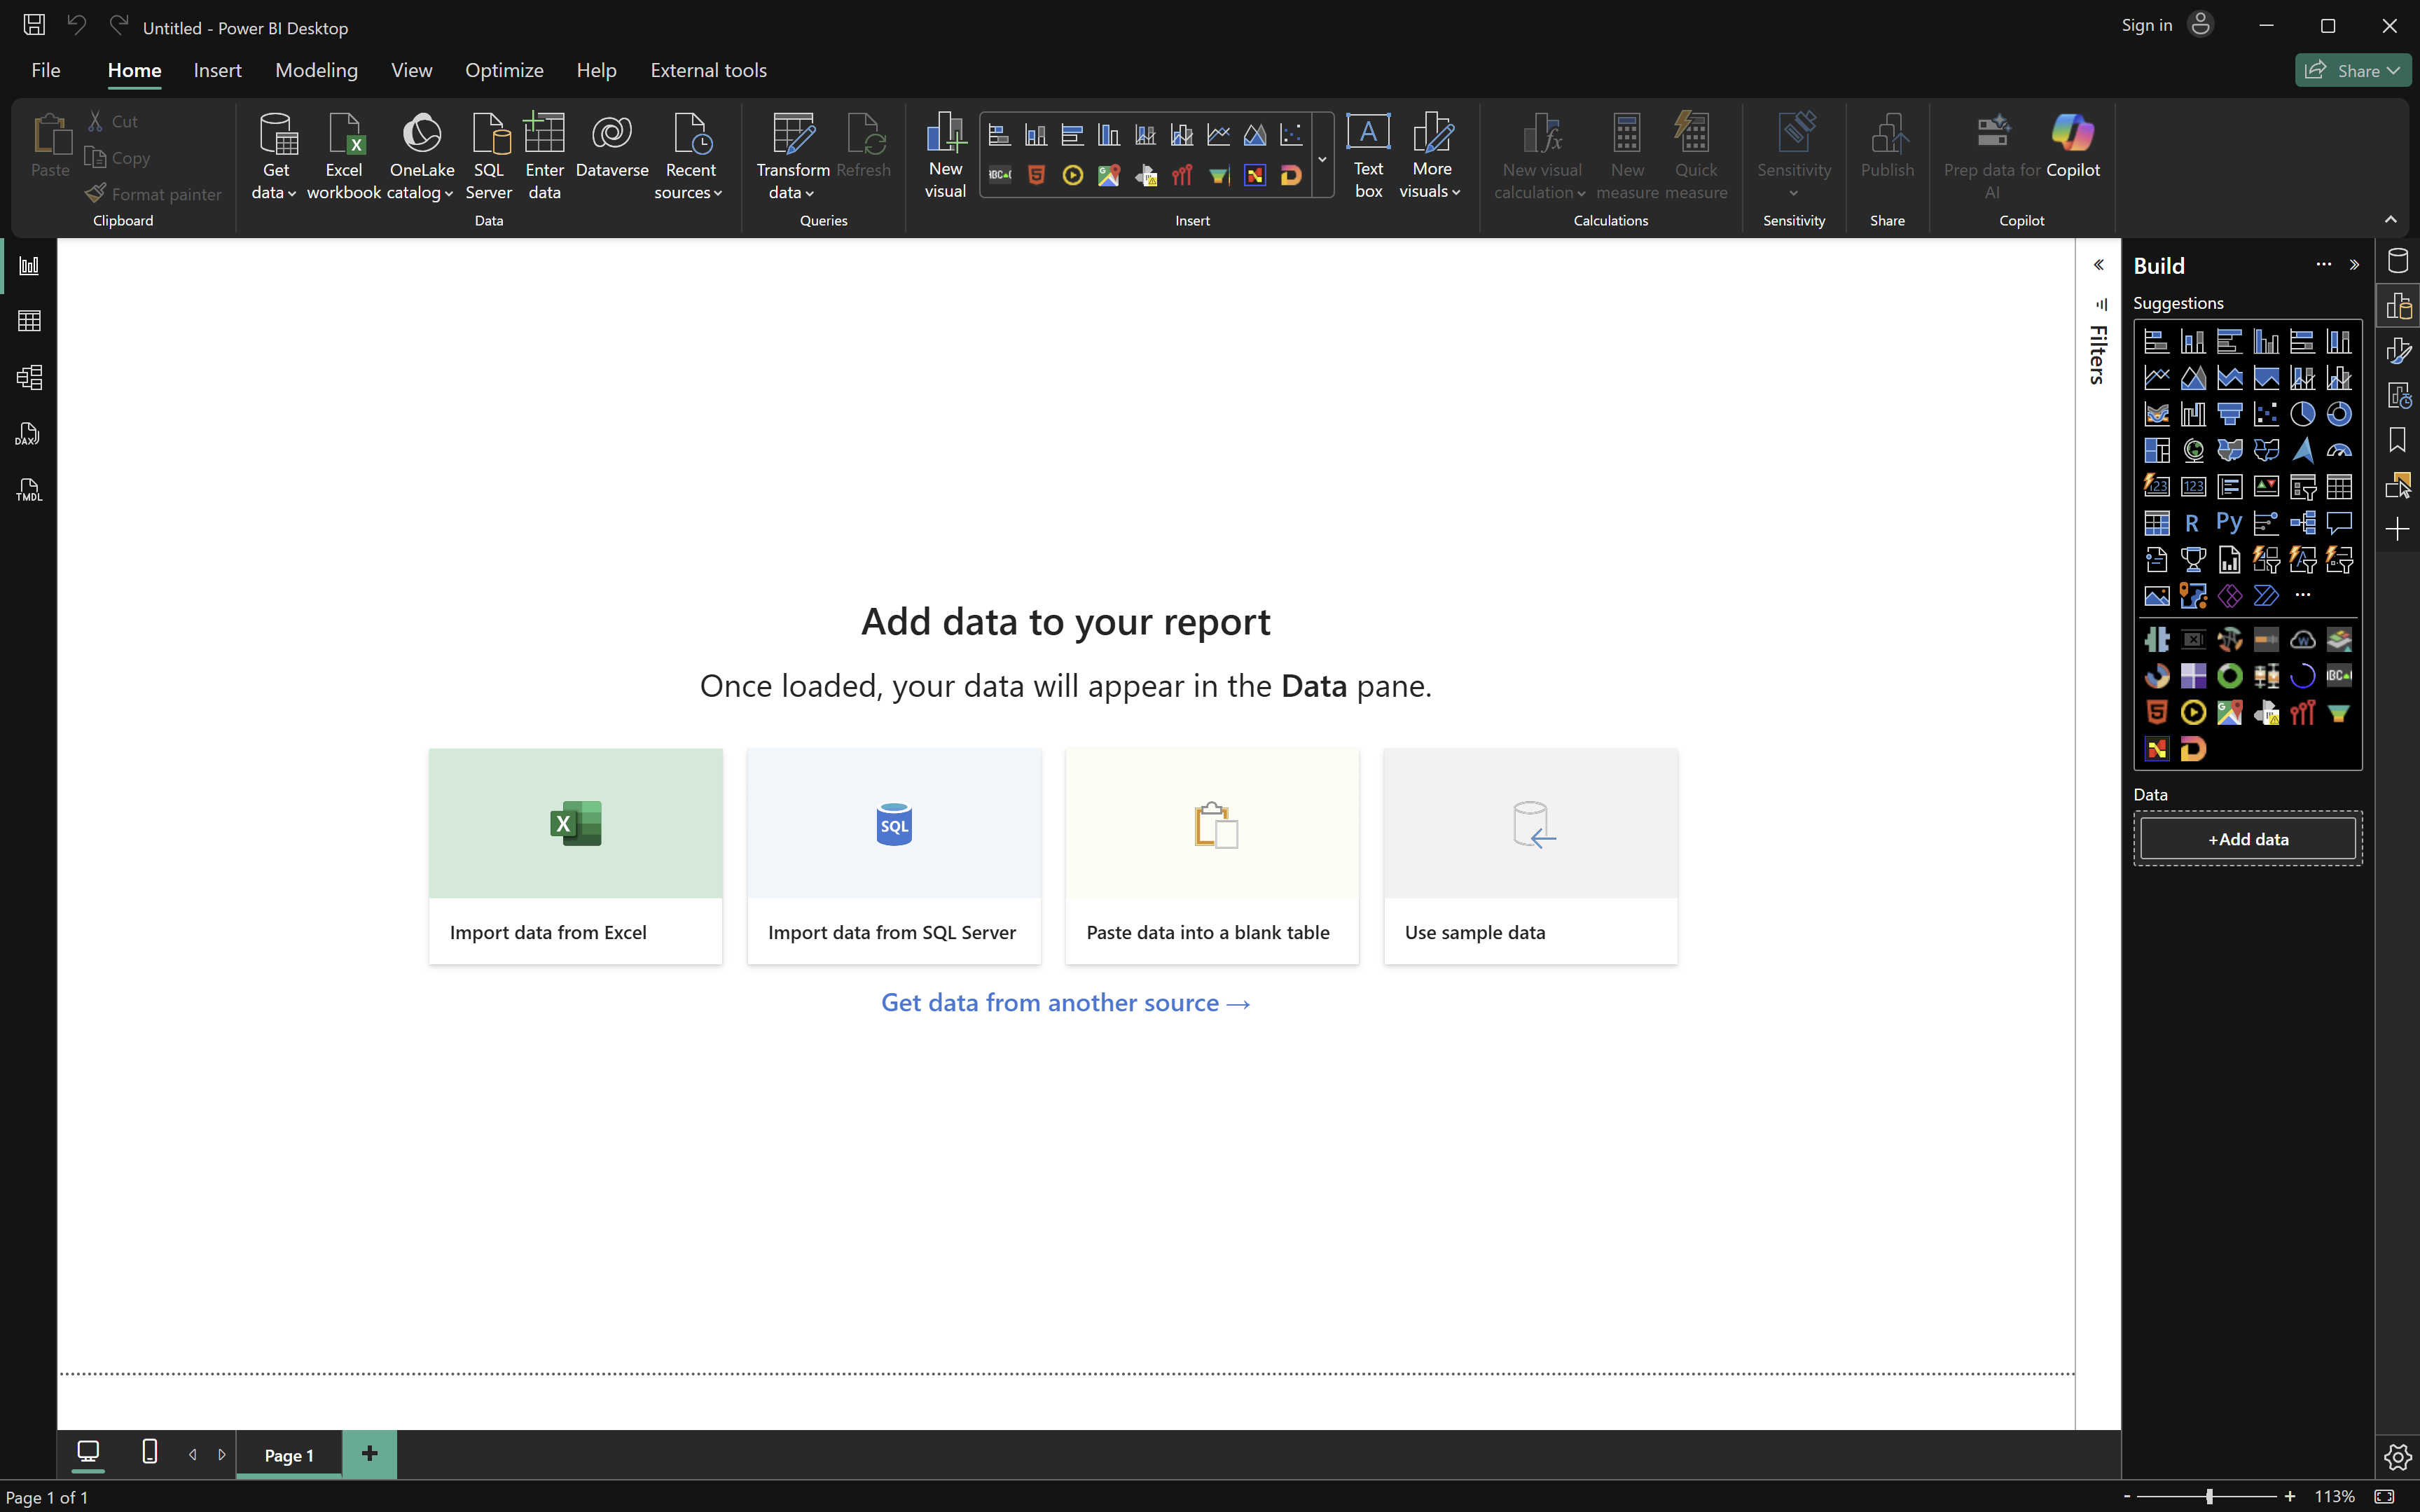
A few facts worth knowing:
- Microsoft updates Desktop every month, and supports only the latest version. Installing it from the Microsoft Store keeps it updated automatically and doesn’t require administrator rights; the alternative is a direct download.
- It runs on Windows 10 or later (see Prerequisites for the requirements).
- The left sidebar switches between views: Report, Table, Model, DAX query and TMDL. You will use all but the last in this book.
Note: Treat Desktop files as controlled work. Fewer authors and agreed standards lead to more reliable reports.
3.2 The Power BI Service (The Restaurant)
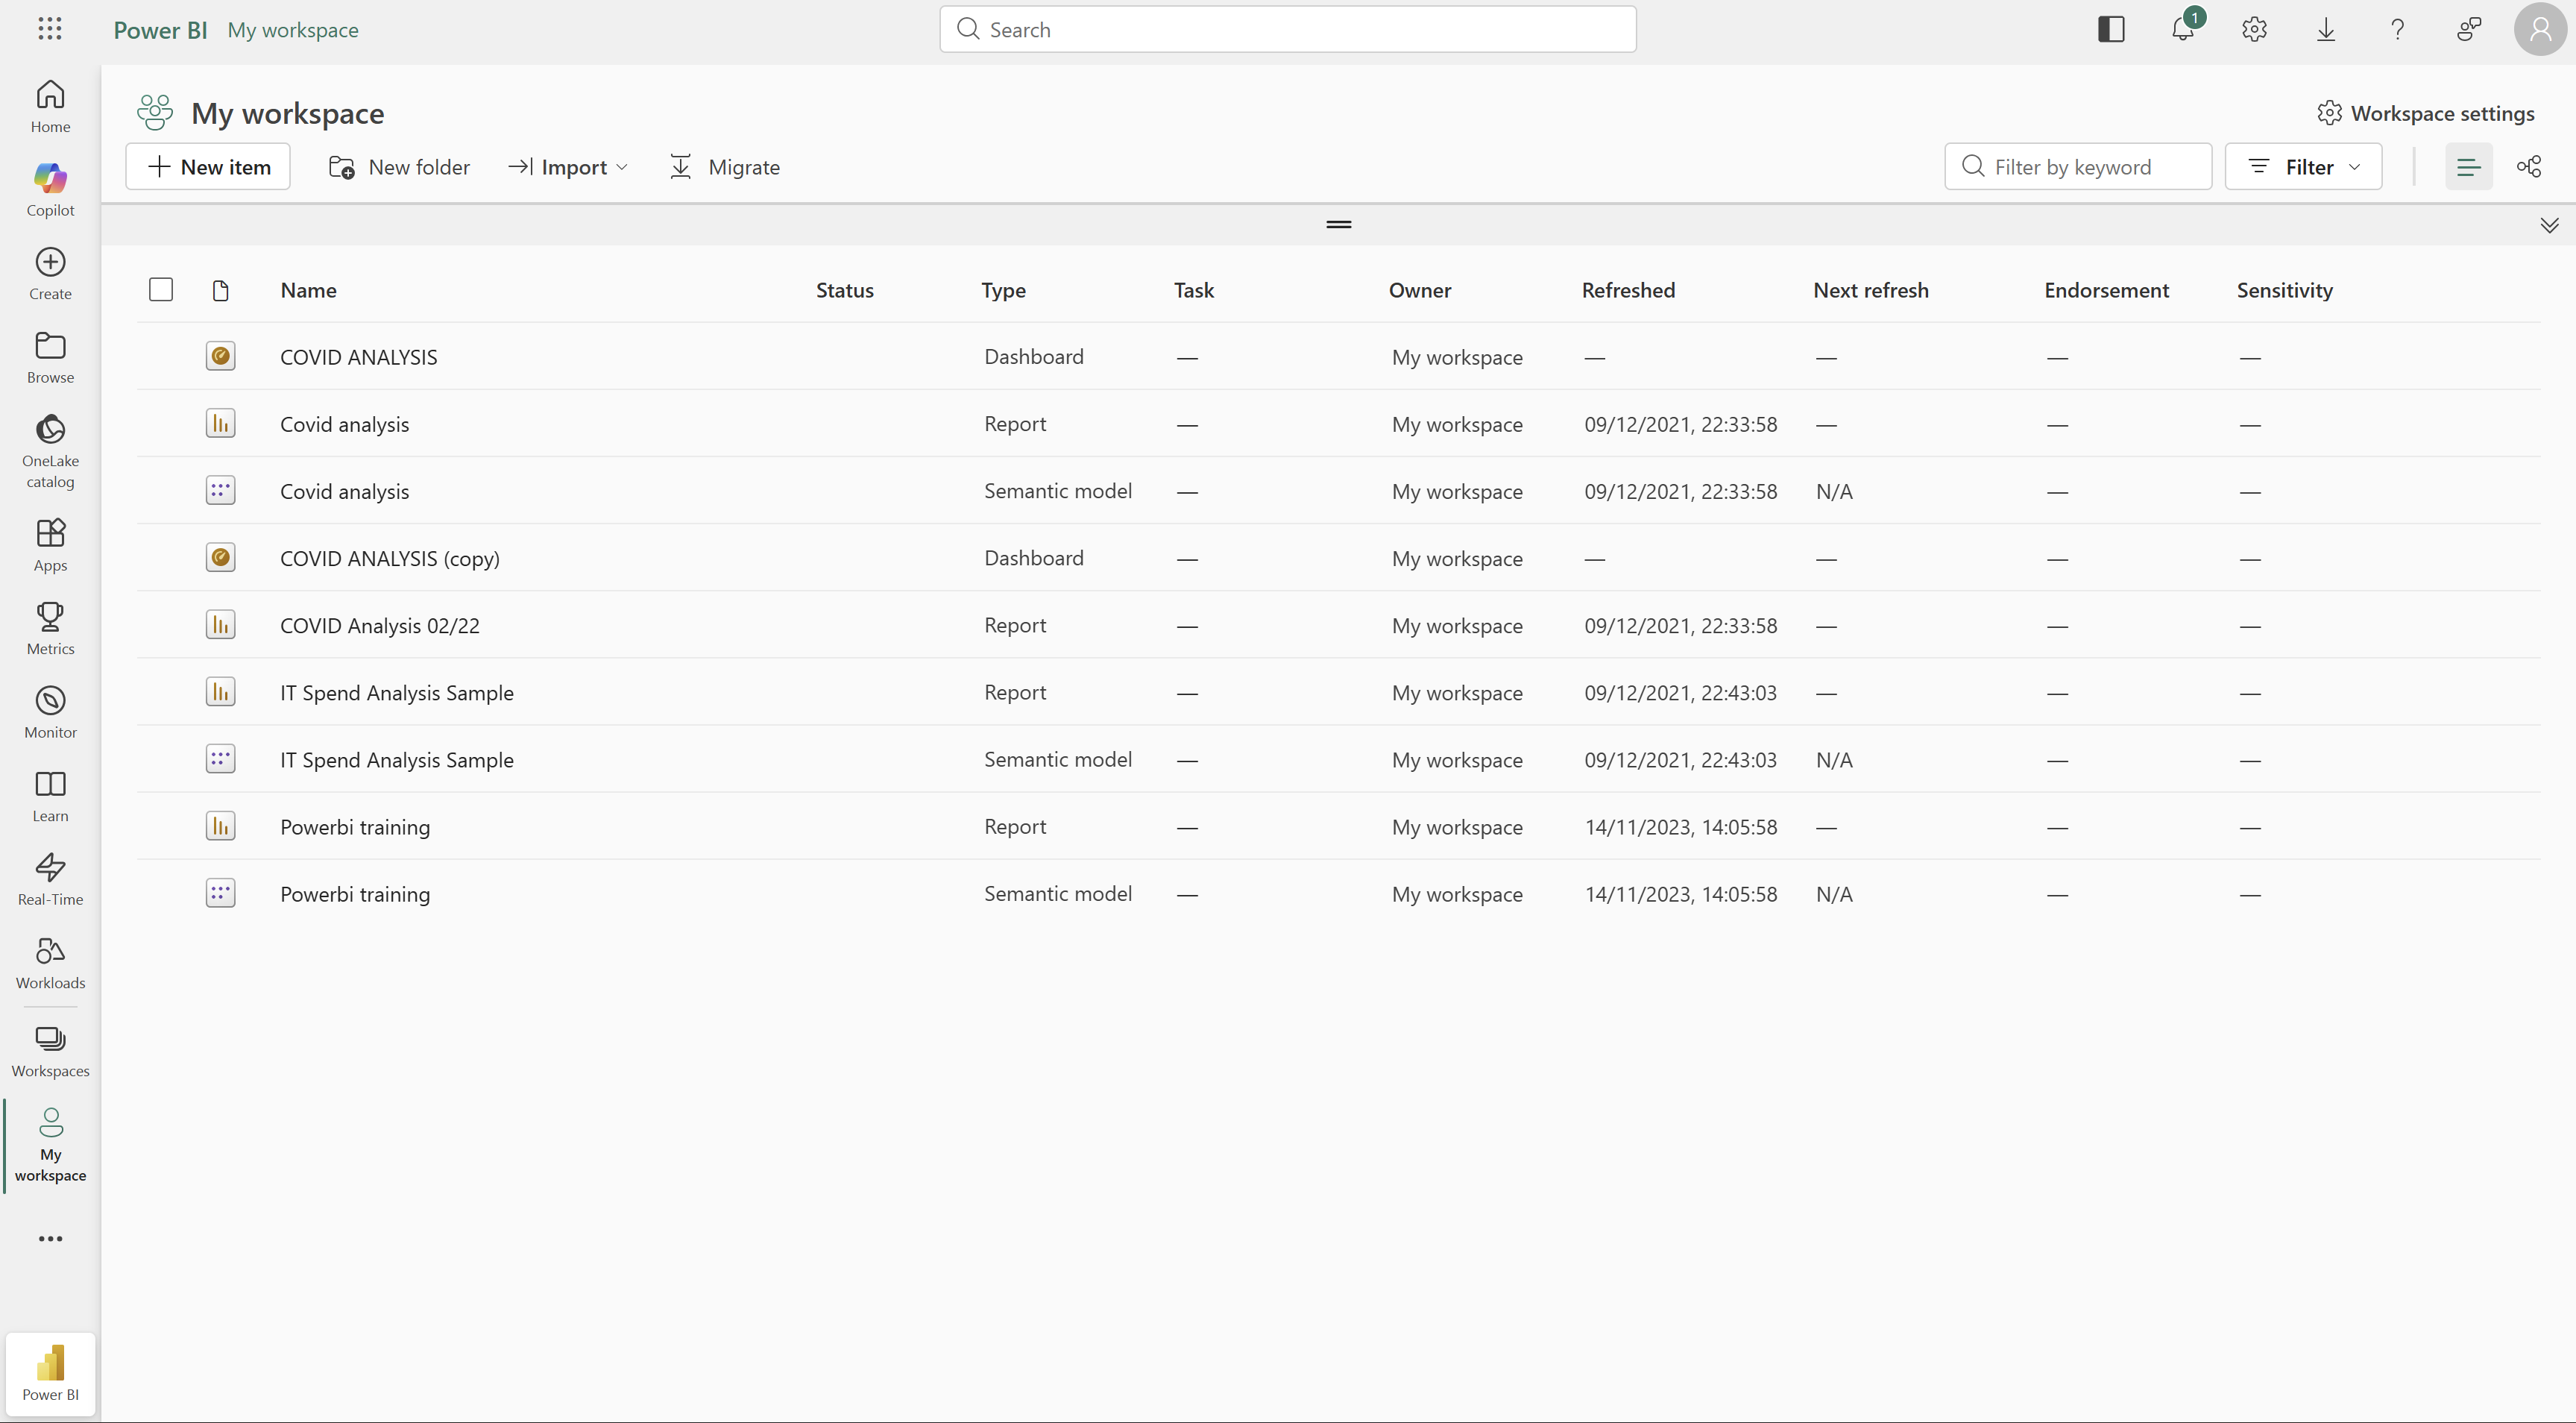
The Power BI service is the cloud platform you use in a web browser
at app.powerbi.com. Power BI is now part of Microsoft Fabric,
Microsoft’s wider data platform, so the same content is also reachable
through the Fabric portal (app.fabric.microsoft.com). For everything
in this book, the Power BI part is all you need.
- Used for: publishing from Desktop, sharing, scheduling refresh, managing permissions and security, distributing apps.
- Used by: analysts and everyone who reads the reports: programme managers, technical leads, partners.
The service is the restaurant. Stakeholders come here to consume data: they can filter, drill down and interact, but readers can’t change the underlying model or calculations.
When you publish from Desktop, the service stores two items:
- a semantic model (formerly called a dataset): the tables, relationships and measures;
- a report: the pages and visuals.
Several reports can use one semantic model, which keeps indicator definitions consistent across reports.
3.2.1 Editing in the browser
Some building work is now possible in the browser: reports can be edited in the service, and Microsoft offers editing of semantic models in the service (marked preview in Microsoft’s documentation in 2026). In September 2026 Microsoft also announced previews of a Power Query editor and a fuller report ribbon on the web. These are useful, for example for Mac users, but Desktop remains the most complete tool, and this book uses Desktop throughout.
3.2.2 Dashboards and reports
In Power BI, a report is a set of interactive pages built in Desktop. A dashboard is a single page in the service made by pinning visuals from reports. This book focuses on reports; in practice, a well-designed report page or app usually serves the purpose people mean when they say “dashboard”.
3.3 Power BI Mobile (The Takeaway)
The Power BI mobile apps for iOS and Android let people view reports and dashboards on phones and tablets.
- Used by: supervisors, field and roving staff, managers between meetings.
- Used for: checking the latest figures before a site visit or meeting.
Report pages can have a mobile layout designed for phones (Chapter 8), which the apps show when the phone is held upright. Mobile users see the same data, with the same permissions and security, as in the browser.
3.4 The On-Premises Data Gateway (The Bridge)
Many health programmes keep data inside their own network:
- a local SQL Server database,
- a DHIS2 instance hosted in a government data centre,
- files on a shared drive.
The Power BI service runs in Microsoft’s cloud and can’t reach these directly. The on-premises data gateway is software installed on a computer inside your network that connects the service to those sources, so that scheduled refresh works.
- Data stored on OneDrive for work or school or SharePoint Online doesn’t need a gateway.
- Microsoft recommends the standard gateway, managed centrally, rather than the personal mode gateway that runs for one user.
- The computer running the gateway must be on whenever refresh is scheduled.
Note: Plan the gateway early. A report built on files on someone’s laptop will work in Desktop and then fail to refresh after publishing.
3.5 Power BI Report Server (On-Premises Option)
Some ministries and organisations must keep reports inside their own network. Power BI Report Server is an on-premises server with a web portal for hosting Power BI reports. It has its own version of Power BI Desktop and its own update schedule, and it is licensed through qualifying SQL Server licenses or Fabric F64-and-above reserved capacity. Viewers don’t need a Pro license to view reports on it.
Report Server doesn’t offer everything the cloud service does. If your organisation is considering it, compare the two with your IT team using Microsoft’s documentation.
3.6 How the Ecosystem Works in Practice
A typical workflow:
- Data is connected, cleaned and modeled in Power BI Desktop.
- The report is published to a workspace in the Power BI service, creating a semantic model and a report.
- The service refreshes the semantic model on a schedule, through a gateway if the data is inside your network.
- Stakeholders use the report through an app, in a browser or the mobile app, seeing only what their permissions allow.
Each component has one responsibility. Respecting these boundaries keeps systems stable.
3.7 Common Misunderstandings to Avoid
-
Using Desktop as a sharing tool. Emailing
.pbixfiles sends all the data with no security, and the copies go out of date. - Letting many people rebuild the same report. Each copy drifts into a different definition of the same indicator.
- Leaving the gateway until the end. Find out early where the data lives and if the service can reach it.
- Expecting the mobile app to replace full reports. Mobile is for checking key figures, not detailed analysis.
3.8 What to Remember from This Chapter
- Power BI Desktop is for building and modeling.
- The Power BI service (part of Microsoft Fabric) is for sharing, refreshing and securing.
- Mobile apps support access in the field.
- The gateway connects the service to data inside your network.
- Report Server is the on-premises alternative when reports must stay inside your network.
The next chapter connects Power BI to data: first the book’s sample files, then DHIS2, KoboToolbox and ODK Central.
Power BI for M&E and Public Health Data Analysts · The Growing Analyst