Chapter: 5 Power Query Basics That Actually Matter
If Power BI is a house, Power Query is the foundation. If the foundation is weak, everything built on top of it will eventually fail.
In public health and development programmes, many reporting problems start long before anyone draws a chart. They start with data preparation that is inconsistent, fragile, or undocumented. Power Query exists to make data cleaning explicit, repeatable, and defensible.
In this chapter you will clean the book’s sample data step by step. Each exercise tells you what you should see when you are done, so you can check your work.
5.1 Why Power Query Matters in Public Health Data
Health data comes from multiple systems, is collected by different people, and often changes definitions over time. Missing values, placeholder codes, and inconsistent formats are common.
When these issues are fixed by hand in Excel, the logic is hidden in someone’s file or memory. Hidden logic cannot be reviewed, reproduced, or trusted.
Power Query records every transformation as a step, in order, and replays the same steps every time the data is refreshed. This is not just convenience. It is governance: anyone can see exactly how raw data became the numbers in the report.
5.2 What Power Query Is (and Is Not)
Power Query is a data transformation engine. In Power BI Desktop, select Transform data on the Home tab to open the Power Query Editor.
Power Query is:
- Repeatable: the same steps run on every refresh.
- Explicit: every change is a named step you can inspect.
- Ordered: steps run from top to bottom.
Power Query is not:
- A visualization tool.
- The place to calculate indicators (that is DAX, Chapter 7).
- A replacement for data modeling (Chapter 6).
Its job is to turn raw, messy data into clean, correctly typed tables.
5.3 The Power Query Editor
The Power Query Editor has five parts:
| Part | What it does |
|---|---|
| Ribbon | Tabs (Home, Transform, Add Column, View, …) with buttons for transformations |
| Queries pane | Lists every query (table) in your file |
| Current view | A preview of the data in the selected query |
| Query Settings | The query’s name (Properties) and its list of Applied Steps |
| Status bar | Information such as the number of columns and the profiling setting |
5.3.1 The Ribbon
The ribbon contains buttons for common transformations such as Remove Rows, Replace Values, Data Type and Merge Queries.
These buttons do not clean data directly. Each one adds a step to the query. The step matters more than the button.

5.3.2 The Queries Pane
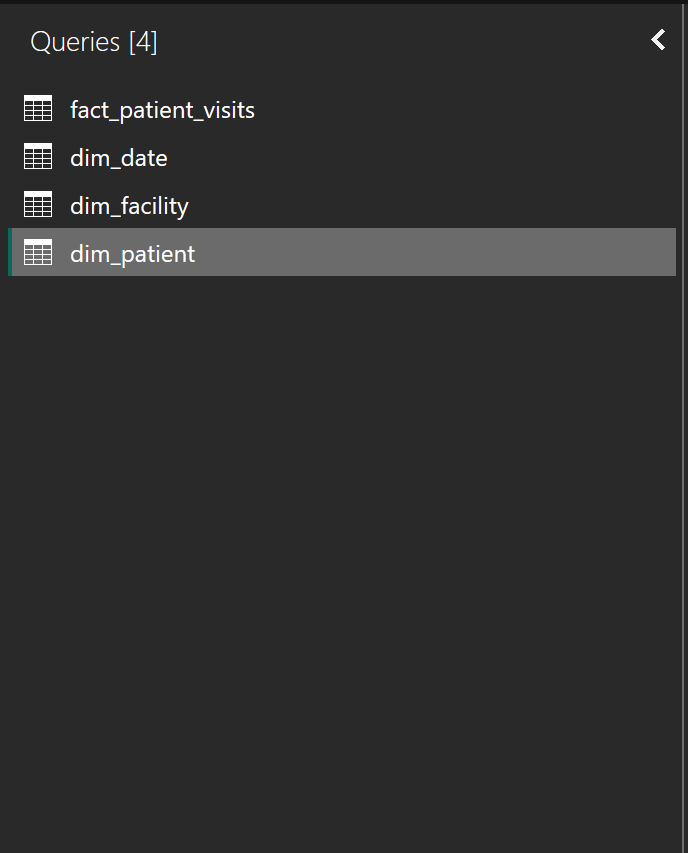
Each item in the Queries pane is a query: one table that will be loaded into your model. After Chapter 4, you should see five queries:
fact_patient_visitsfact_targetsdim_patientdim_facilitydim_date
Clean each query on its own. Do not combine them into one table; the model connects them later.
5.3.3 Applied Steps
Applied Steps, in the Query Settings pane, is the most important part of Power Query. Every transformation you make appears here as a step. Select any step to see the data as it was at that point.
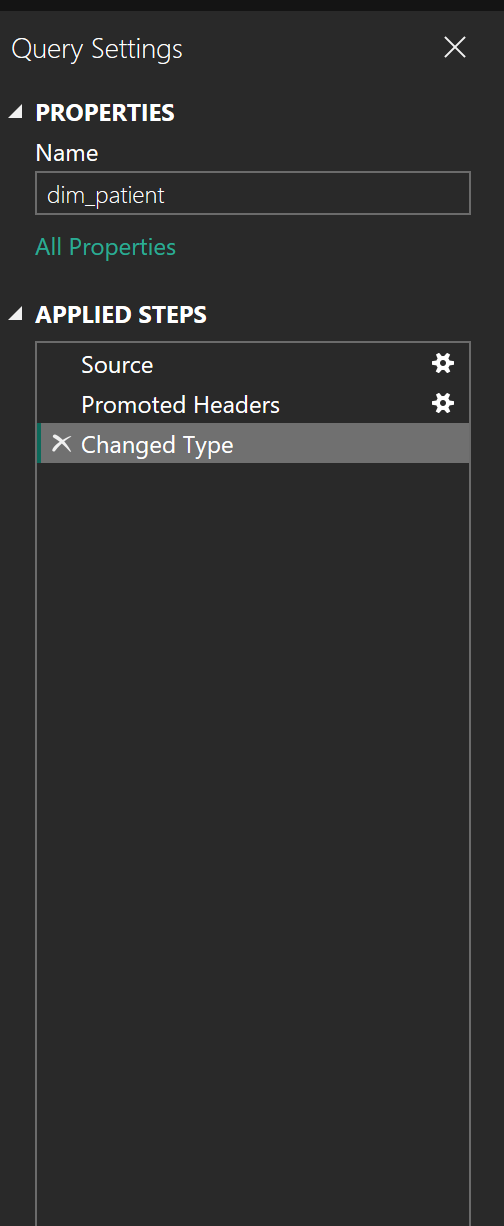
Together, these steps form a data preparation record: exactly how raw data becomes analysis-ready. Deleting or reordering steps changes that record, and can change your results.
5.3.4 The Advanced Editor
Every step is written in Power Query’s formula language, M. To see the full query as code, select Advanced Editor (on the Home tab, or on the View tab). You do not need to write M to use Power Query, but reading it is the fastest way to check what a query really does. The complete M code for this chapter is in The Complete Query.
5.4 Recording Logic, Not Fixing Cells
In Excel, you fix a cell and the reason lives in your head. In Power Query, you define a rule and the rule lives in the steps.
When next month’s file arrives and you select Refresh, Power Query applies every step again: the same rules, in the same order. That is the difference between one-off reporting and sustainable monitoring.
Before you add any step, ask:
- Will this still work when new rows arrive?
- Will this still work if the values are slightly different next time?
- Could another analyst understand this step?
If the answer is no, find a rule instead. For example, replacing the
exact text "Tld" with "TLD" fixes today’s file. Trimming spaces and
converting to uppercase fixes "Tld", "tld " and any other variation
that appears next month.
5.5 Before You Start: Three Settings That Prevent Silent Errors
Power Query makes three automatic decisions that can hide problems in your data. Check them before you clean anything.
5.5.1 1. Text encoding (File Origin)
According to Microsoft’s documentation, Power Query only detects UTF-8 text automatically when the file starts with a UTF-8 byte-order mark. The book’s CSV files are UTF-8 without a byte-order mark.
You can see the effect in dim_patient, where age_group contains an
en dash (15–49). If the file is read with the wrong encoding, the value
appears as 15–49.
To check and fix it:
- Select the
dim_patientquery. - In Applied Steps, select the gear icon next to Source.
- Set File Origin to 65001: Unicode (UTF-8) and select OK.
- Confirm that
age_groupshows<5,5–14,15–49and50+.
Repeat this for every query. Only dim_patient contains characters
that show the problem, but setting UTF-8 everywhere prevents surprises
when the data changes.
5.5.2 2. Automatic data types
When you load a CSV file, Power Query adds a Changed Type step that guesses each column’s data type from the first 200 rows. A guess based on 200 rows can be wrong for the remaining rows of the file.
In this chapter you will set every data type yourself, after cleaning. So, for each query:
- In Applied Steps, select Changed Type.
- Select the X next to it to delete the step.
All columns are now text. That is expected at this stage.
Tip: For new files, you can avoid the guess altogether. In the Text/CSV import dialog, set Data Type Detection to the option that turns detection off, and set types yourself.
5.5.3 3. Profiling based on 1,000 rows
The data profiling tools you will use next look at the first 1,000
rows by default. fact_patient_visits has 10,030 rows, so a problem
in row 5,000 would be invisible.
To profile every row, select the message Column profiling based on top 1000 rows in the status bar and change it to Column profiling based on entire data set.
5.6 Exercise 5.1: Profile the Data Before Changing It
Objective: Find the problems before you fix anything.
Steps:
- Select the
fact_patient_visitsquery. - On the View tab, in the Data Preview group, turn on Column quality, Column distribution and Column profile.
- Make sure profiling is based on the entire data set (see above).
- Investigate the columns below. Hover over the distribution bars under each column name to see the distinct count (different values) and the unique count (values that appear only once).
What to look for:
| Column | Question to answer |
|---|---|
visit_id |
Should every visit ID appear once? Compare the distinct and unique counts. |
anc_visit |
How many distinct values are there? How many should there be? |
art_regimen |
Which values look like the same regimen written differently? |
tb_test_date |
Use Text Filters → Contains to look for /. How many rows match? |
art_start_date |
Sort ascending. What is the earliest date? Is it plausible? |
| Any column with gaps | How are missing values written? |
What you should find:
-
visit_idhas 10,000 distinct values but only 9,970 unique values: 30 visits appear twice. -
anc_visithas 4 distinct values (No,Yes,yes,YES) instead of 2. -
art_regimencontainsTLD,TldandTLD(with a trailing space). -
343 rows in
tb_test_datecontain/, for example2024/03-15. - The earliest
art_start_dateis1900-01-01, a placeholder rather than a real date. - Missing values are written as the text
NA.
Write these down. Every step that follows fixes one of them. The full list of issues is in the Known Data-Quality Issues appendix.
5.7 Cleaning the Fact Table
Do the following exercises in this order, all in the
fact_patient_visits query. Each one adds a step to Applied Steps.
5.7.1 Exercise 5.2: Remove Duplicate Rows
Why: The same visit entered twice would be counted twice in every indicator.
Steps:
- Select the first column header (
visit_id), then hold Shift and select the last column header (art_line). All columns are now selected. - On the Home tab, in the Reduce Rows group, select Remove Rows → Remove Duplicates.
Selecting all columns matters: a row is removed only if every column
matches another row. Remove duplicates on visit_id alone would also
remove rows that share an ID but differ elsewhere, hiding a different
kind of problem.
Note: Power Query compares text exactly, including upper and lower case.
"Yes"and"YES"are different values. If duplicates in your own data differ only by case or spacing, standardize those columns first.
Check your work: On the Transform tab, select Count Rows. The result should be 10,000. Count Rows counts every row, whatever the profiling setting. Then delete the step it added.
5.7.2 Exercise 5.3: Replace NA with Null
Why: NA is text. Power Query does not treat it as missing. Null is
Power Query’s value for “missing”, and the data model treats it as
blank.
Steps:
- Select all columns again (first header, then Shift + last header).
- On the Home tab, select Replace Values.
- In Value To Find, enter
NA. - In Replace With, enter
null(lowercase). - Expand Advanced options and select Match entire cell contents.
- Select OK.
Check the formula bar. It should show null without quotation marks
as the second value, for example:
= Table.ReplaceValue(#"Removed Duplicates", "NA", null, Replacer.ReplaceValue, {...})If it shows "null" in quotation marks, you have replaced NA with the
text “null”. Edit the formula to remove the quotation marks.
Why “Match entire cell contents”? Without it, Power Query replaces
the letters NA anywhere inside a value. With it, only cells whose
entire value is NA are replaced. In the formula, this is the
difference between Replacer.ReplaceText (part of a value) and
Replacer.ReplaceValue (the whole value).
Check your work: Hover over the Column quality bar. tb_test_date
should show 6,759 empty values and art_line 9,805 empty values.
5.7.3 Exercise 5.4: Standardize Yes/No Values
Why: A filter or measure looking for "Yes" will not count " yes "
or "YES".
Steps:
- Select the
anc_visitcolumn. - On the Transform tab, in the Text Column group, select Format → Trim. This removes leading and trailing spaces.
- Select Format → Capitalize Each Word. This changes
yesandYEStoYes.
Check your work: anc_visit has 2 distinct values: Yes
(330) and No (9,670).
The other Yes/No columns in this file are already consistent. In your own data, apply the same two steps to every Yes/No column. They do no harm to values that are already clean.
5.7.4 Exercise 5.5: Standardize Regimen Labels
Steps:
- Select the
art_regimencolumn. - Select Format → Trim.
- Select Format → UPPERCASE.
Check your work: art_regimen contains TLD (127), ABC-3TC-DTG
(35), TLE (27), AZT-3TC-NVP (2) and nulls.
5.7.5 Exercise 5.6: Fix the TB Test Date Format
Why: 2024/03-15 mixes two separators. Fix the text before you
convert the column to a date.
Steps:
- Select the
tb_test_datecolumn. - Select Replace Values. In Value To Find, enter
/. In Replace With, enter-. Do not select Match entire cell contents: you want to replace the character wherever it appears.
Check your work: Text Filters → Contains / now returns no rows.
Remove that filter step afterwards.
5.7.6 Exercise 5.7: Replace the Placeholder Date
Why: 1900-01-01 is a valid date. Power Query’s Date/Time type
supports dates from the year 1900 onwards, so this placeholder converts
without any error. It would quietly become a real ART start date 124
years before the visit. Silent errors like this are the most dangerous
kind.
Steps:
- Select the
art_start_datecolumn. - Select Replace Values. Value To Find:
1900-01-01. Replace With:null. Select Match entire cell contents. - Check the formula bar for
nullwithout quotation marks.
Check your work: Sorted ascending, the earliest art_start_date is
now 2024-01-04.
5.7.7 Exercise 5.8: Remove Duplicated Date Columns
Why: year, quarter, month and iso_week are copies of columns
in dim_date. Keeping them in the fact table creates two sources for the
same information. Chapter 6 explains why descriptions
belong in dimension tables.
Steps:
- Select
year, then hold Ctrl and selectquarter,monthandiso_week. - On the Home tab, select Remove Columns.
Check your work: The table has 20 columns. date_id is still
there; it is the link to dim_date.
5.7.8 Exercise 5.9: Set the Data Types
Now that the values are clean, set each column’s type explicitly. Select the column, then on the Home tab select Data Type and choose the type.
| Columns | Data type |
|---|---|
visit_id, patient_id, facility_id, date_id
|
Whole Number |
tb_test_date, art_start_date
|
Date |
| All other columns | Text |
Leave the Yes/No columns as Text so that slicers and tables show “Yes” and “No”.
Check your work: Column quality shows 0% Error for every column.
If tb_test_date or art_start_date shows errors, select an error
cell to read the message, and check that Exercises 5.6 and 5.7 come
before this step in Applied Steps.
tb_test_date should now range from 2024-01-01 to 2025-01-03,
because a sample can be collected up to 3 days after the visit.
5.8 Finding Problems You Should Not Fix Here
Some problems should be found and reported, not fixed. Changing a clinical record because it looks wrong is a decision for the programme, not for the analyst.
5.8.1 Exercise 5.10: Check ART Records for Missing Information
Steps:
- Filter
art_startedtoYes. - Look at
art_regimenandart_start_date.
What you should find:
-
4 rows where the patient is on ART but
art_regimenis empty. -
6 rows where
art_start_dateis empty. These are the rows that had the 1900-01-01 placeholder.
What to do: Leave these values empty. Do not guess a regimen or a
start date. Remove the filter step, then record what you found: right-
click the step that replaced 1900-01-01, select Properties, and
add a description such as “6 ART records had placeholder start date
1900-01-01; set to null. Reported to data team.”
5.8.2 Exercise 5.11: Build a Validation Query (ANC Visits for Male Patients)
An ANC visit recorded for a male patient is a data-entry error, but you can only see it by comparing two tables. You can do that check in a separate validation query that is never loaded into the report.
Do this after you have set the data types in dim_patient (see
Cleaning the Other Tables), so that patient_id is
a Whole Number in both queries.
Steps:
- In the Queries pane, right-click
fact_patient_visitsand select Reference. A new query appears that starts from the cleanedfact_patient_visits. - Rename it
check_anc_male(double-click the name in the Queries pane). - On the Home tab, select Merge Queries.
- Select
patient_idin the top table. In the drop-down list, choosedim_patient, select itspatient_idcolumn, set Join Kind to Left Outer, and select OK. - Select the expand icon in the header of the new
dim_patientcolumn. Select onlysex, clear Use original column name as prefix, and select OK. - Filter
anc_visittoYesandsextoMale. - Right-click
check_anc_malein the Queries pane and clear Enable load. The query stays in your file for checking, but it is not loaded into the model.
What you should find: 10 rows. Share the visit_id values with
the people responsible for data entry so they can be corrected at the
source.
A Reference query starts from the result of another query, so it always uses the latest cleaned data. It does not copy the steps.
5.9 Name Your Steps
Power Query names steps after the button you selected: Replaced Value, Replaced Value1, Replaced Value2. Six months later, nobody knows what they do.
5.9.1 Exercise 5.12: Rename the Applied Steps
Right-click each step, select Rename, and describe what the step does:
| Default name | Better name |
|---|---|
| Removed Duplicates | Remove Duplicate Rows |
| Replaced Value | Replace NA With Null |
| Trimmed Text, Capitalized Each Word | Standardize ANC Yes No |
| Trimmed Text1, Uppercased Text | Standardize Regimen Labels |
| Replaced Value1 | Fix TB Test Date Format |
| Replaced Value2 | Replace Placeholder ART Date |
| Removed Columns | Remove Duplicated Date Columns |
| Changed Type | Set Data Types |
Your default names may differ slightly. What matters is that the new name says why the step exists.
Reflection: Could a colleague take over this file tomorrow and understand every step? Would it hold up in an audit?
5.10 Why the Order of Steps Matters
Steps run from top to bottom, and each step works on the result of the one above it. In this chapter:
-
NAmust become null before setting data types. Otherwise everyNAin a date column becomes an Error. - Fix the date format and the placeholder before converting to Date. It is simpler to replace text than to repair dates afterwards.
- Remove Duplicates compares values exactly. If duplicate records differed only in case or spacing, you would need to standardize those columns first.
- Removing a column breaks any later step that uses it. If a step shows an error after you delete or move something, select it to see which column it expected.
When something goes wrong in Power Query, check the order of the steps first.
5.11 Check Your Work: fact_patient_visits After Cleaning
| Check | Expected result |
|---|---|
| Rows | 10,000 |
| Columns | 20 |
anc_visit |
Yes 330, No 9,670 |
art_regimen |
TLD 127, ABC-3TC-DTG 35, TLE 27, AZT-3TC-NVP 2, null 9,809 |
tb_test_date |
3,241 dates from 2024-01-01 to 2025-01-03; 6,759 null |
art_start_date |
189 dates from 2024-01-04 to 2024-11-23; 9,811 null |
| Errors in any column | 0 |
check_anc_male |
10 rows, load disabled |
5.12 The Complete Query
This is the M code for the cleaned fact_patient_visits query. To see
your own version, select Advanced Editor. If your results do not
match the table above, compare your code with this one.
Change the file path in the Source step to where you saved the file.
let
    Source = Csv.Document(
        File.Contents("C:\PowerBI-Book\data\fact_patient_visits.csv"),
        [Delimiter = ",", Encoding = 65001]
    ),
    #"Promoted Headers" = Table.PromoteHeaders(Source, [PromoteAllScalars = true]),

    #"Remove Duplicate Rows" = Table.Distinct(#"Promoted Headers"),

    #"Replace NA With Null" = Table.ReplaceValue(
        #"Remove Duplicate Rows", "NA", null, Replacer.ReplaceValue,
        Table.ColumnNames(#"Remove Duplicate Rows")
    ),

    #"Standardize ANC Yes No" = Table.TransformColumns(
        #"Replace NA With Null",
        {{"anc_visit", each Text.Proper(Text.Trim(_)), type text}}
    ),

    #"Standardize Regimen Labels" = Table.TransformColumns(
        #"Standardize ANC Yes No",
        {{"art_regimen", each Text.Upper(Text.Trim(_)), type text}}
    ),

    #"Fix TB Test Date Format" = Table.ReplaceValue(
        #"Standardize Regimen Labels", "/", "-", Replacer.ReplaceText,
        {"tb_test_date"}
    ),

    #"Replace Placeholder ART Date" = Table.ReplaceValue(
        #"Fix TB Test Date Format", "1900-01-01", null, Replacer.ReplaceValue,
        {"art_start_date"}
    ),

    #"Remove Duplicated Date Columns" = Table.RemoveColumns(
        #"Replace Placeholder ART Date", {"year", "quarter", "month", "iso_week"}
    ),

    #"Convert Dates" = Table.TransformColumns(
        #"Remove Duplicated Date Columns",
        {
            {"tb_test_date", each Date.FromText(_, [Format = "yyyy-MM-dd"]), type date},
            {"art_start_date", each Date.FromText(_, [Format = "yyyy-MM-dd"]), type date}
        }
    ),

    #"Set Data Types" = Table.TransformColumnTypes(
        #"Convert Dates",
        {
            {"visit_id", Int64.Type}, {"patient_id", Int64.Type},
            {"facility_id", Int64.Type}, {"date_id", Int64.Type},
            {"anc_visit", type text}, {"malaria_tested", type text},
            {"tb_screened", type text}, {"hiv_tested", type text},
            {"ncd_screened", type text}, {"malaria_positive", type text},
            {"tb_test_done", type text}, {"tb_positive", type text},
            {"hiv_positive", type text}, {"art_started", type text},
            {"hypertension", type text}, {"diabetes", type text},
            {"art_regimen", type text}, {"art_line", type text}
        }
    )
in
    #"Set Data Types"
A few things to notice:
-
Encoding = 65001is the File Origin setting (UTF-8). -
Text.Propercapitalizes the first letter of each word and makes the other letters lowercase, so"yes"and"YES"both become"Yes". -
Date.FromTextwithFormat = "yyyy-MM-dd"reads the dates using exactly that pattern, whatever your computer’s regional settings are. - The code converts the two date columns in their own step. If you followed the exercises using the ribbon, your code will set them in the Set Data Types step instead. Both give the same result.
5.13 Cleaning the Other Tables
The other four tables need much less work. For each one: set File Origin to UTF-8, delete the automatic Changed Type step, and set the types below.
| Query | Whole Number | Date | Text | Rows |
|---|---|---|---|---|
dim_patient |
patient_id, age
|
– |
sex, hiv_status, age_group, pregnant
|
3,500 |
dim_facility |
facility_id |
– | all other columns | 60 |
dim_date |
date_id, year, month_num, iso_year, iso_week
|
date |
quarter, month
|
366 |
fact_targets |
facility_id, date_id, target
|
– | indicator |
960 |
Check dim_patient[age_group] shows 15–49, not 15–49.
In fact_targets, remove the year and quarter columns, as you did
for the visits table in Exercise 5.8. date_id (the first day of each
quarter) is the link to dim_date, which already holds the year and
quarter.
dim_date should be clean by design. If you ever find problems in a
date table, look for the cause upstream.
5.14 Will It Still Work Next Month?
A query that works today can fail quietly when next month’s file arrives. Watch for these:
-
The number of columns is fixed at import. When you import a CSV,
Power BI Desktop records the number of columns in the Source step (for
example
Columns=24). Microsoft’s documentation notes that if the file later gains columns, refresh does not include them. If your source might add columns, remove theColumns=setting from the Source step. The complete query above does not use it. -
Rules beat exact replacements. Trim and Capitalize Each Word fix
any spacing or capitalization. A Replace Values step for
"YES"fixes only"YES". - File paths are fixed. If the CSV file moves, refresh fails. Keep data files in one agreed folder, and update the path in the Source step if it changes.
5.15 Wide and Tall Data
Some exports place time periods or indicators across columns: one column per month, for example. This is easy to read but hard to analyse.
Power BI works best with tall tables, where time and indicator are values in a column, not column names. To convert a wide table:
- Select the identifier columns (for example, facility and indicator).
- Right-click and select Unpivot Other Columns.
- Rename the new
AttributeandValuecolumns, for example toMonthandCount.
The book’s sample data is already tall, so this chapter has no exercise for it. You will meet wide data often in practice.
5.16 Data Quality Rules Applied in This Chapter
| Table | Column | Issue | Rule applied | Rows |
|---|---|---|---|---|
fact_patient_visits |
all | Exact duplicate rows | Remove duplicates across all columns | 30 |
| all | all | Missing values stored as text NA
|
Replace whole-cell NA with null |
many |
fact_patient_visits |
anc_visit |
" yes ", "YES"
|
Trim, then Capitalize Each Word | 132 |
fact_patient_visits |
art_regimen |
"Tld", "TLD "
|
Trim, then UPPERCASE | 31 |
fact_patient_visits |
tb_test_date |
/ used as a separator |
Replace / with -
|
342 |
fact_patient_visits |
art_start_date |
Placeholder 1900-01-01
|
Replace with null; document | 6 |
fact_patient_visits |
year, quarter, month, iso_week
|
Duplicated from dim_date
|
Remove columns | – |
fact_patient_visits |
art_regimen |
Missing while on ART | Leave null; report | 4 |
fact_patient_visits + dim_patient
|
anc_visit, sex
|
ANC visit for a male patient | Validation query; report | 10 |
dim_patient |
age_group |
Wrong characters if read with the wrong encoding | File Origin = UTF-8 | – |
Row counts after removing duplicates. These rules prepare clean data. They do not define indicators; that happens in DAX.
5.17 What Not to Do in Power Query
- Do not calculate indicators, ratios or percentages. An indicator must recalculate when users filter the report by district or month. DAX measures do this; a pre-calculated column does not.
- Do not merge dimension columns into the fact table to “simplify” the model. A validation query with load disabled is fine; the tables that are loaded should stay separate.
- Do not fill in clinical values that are missing or look wrong. Report them.
- Do not leave default step names.
Power Query gives you control over data. Modeling gives you control over meaning.
5.18 Stop Point: Before You Leave Power Query
Confirm that:
- Every query uses File Origin 65001: Unicode (UTF-8).
- No query has an automatic Changed Type step; you set every data type yourself.
-
fact_patient_visitsmatches the Check Your Work table. - Column quality shows 0% errors in every query.
-
check_anc_malehas Enable load cleared. - Every step has a descriptive name.
Then select Close & Apply on the Home tab to load the cleaned tables into Power BI.
At this point, the data is clean, not yet meaningful. In the next chapter, you will connect these tables into a star schema so that indicators can be calculated consistently.
Power BI for M&E and Public Health Data Analysts · The Growing Analyst