Chapter: 8 Designing Dashboards People Actually Use
A dashboard is not an art project. It is a decision-support tool.
In Monitoring and Evaluation and public health, dashboards exist to answer questions, guide action, and surface risk. A visually impressive dashboard that does not support decisions has failed its purpose.
This chapter is about choosing the right visual for the question being asked. The wrong visual can mislead even when the data and the DAX are correct. The exercises use the measures you built in Chapter 7.
8.1 Start With the Question, Not the Visual
Before selecting anything from the Visualizations pane, ask:
- What decision is this page meant to support?
- Who will use it, and how often?
- What comparison matters most: over time, between places, or against a target?
- What should the user notice first?
Different questions need different visuals. There is no “best” visual on its own.
8.2 A Practical Page Layout
A layout that works well for monitoring dashboards places information in the order people need it:
- Top left: status. Cards with the headline indicators (for example, Malaria Tested and % of Target). These answer “Are we on track?”
- Top right: filters. Slicers for period and geography, so users frame the question before reading the numbers. Keep slicers in the same place on every page.
- Middle: trends and comparisons. Line charts over time; bar charts across places.
- Bottom: detail. A table or matrix for users who need exact numbers or want to check a figure.
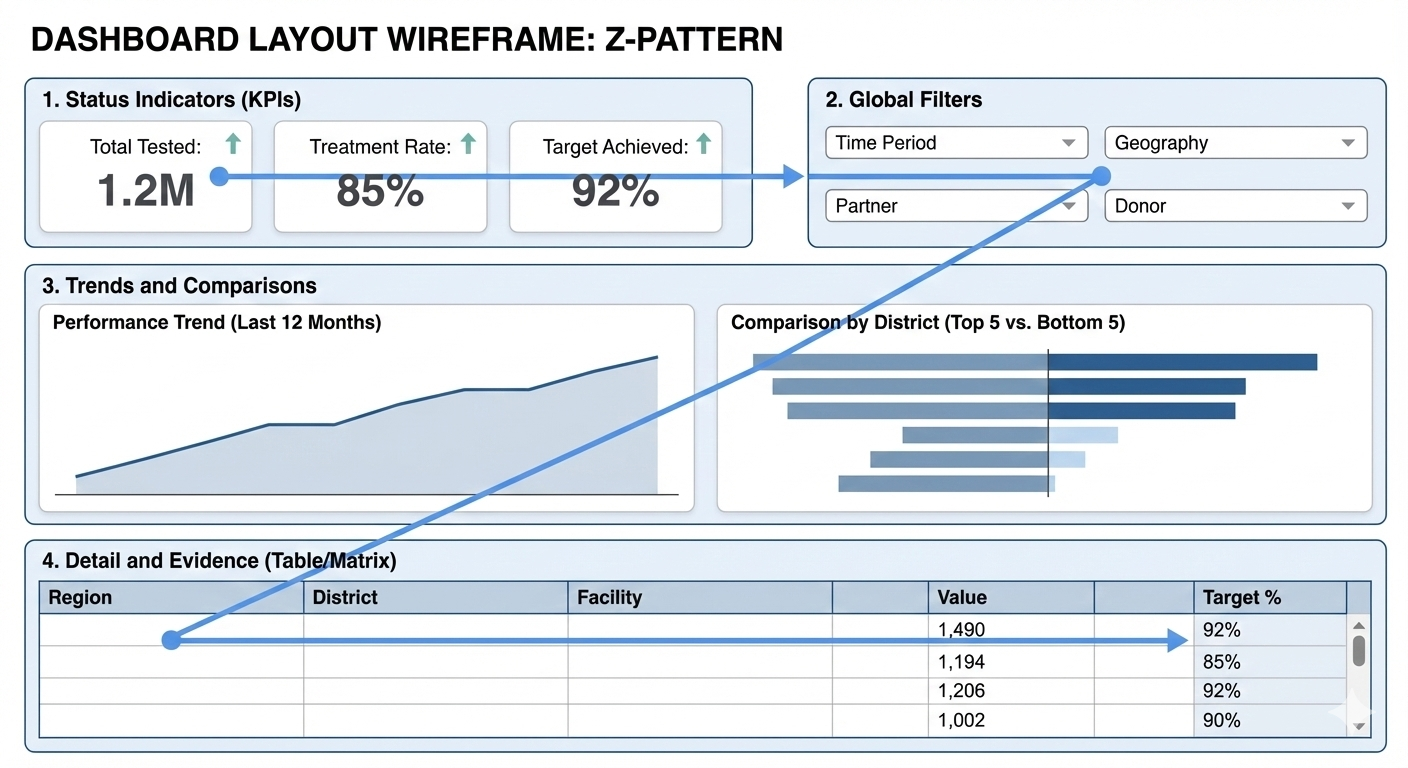
A consistent layout reduces effort: users should not have to hunt for meaning.
8.3 Choosing the Right Visual
8.3.1 Status: cards
Question: “What is the headline number, and how does it compare?”
Use the Card visual. The current card visual became generally available in November 2025 and replaces both the old single card and multi-row card. One card visual can hold several measures, and each card can show reference labels, for example a target or a percentage, next to the main value.
A number alone means little: “7,062 malaria tests” raises the question “is that good?” Always add context, such as % of target or the previous period.
8.3.2 Change over time: line charts
Question: “How is this changing?”
Use a Line chart. Time is continuous, and direction (up or down) is easier to see on a line than on bars.
- Good for: monthly service uptake, quarterly progress, trends after an intervention.
- Avoid: column charts for long time series, and tables for spotting trends.
8.3.3 Comparing categories: bar charts
Question: “Which is higher or lower?”
Use a Bar chart (horizontal). Lengths are easier to compare than angles or areas, and long names such as facilities fit on the axis.
Always sort. Sorted descending, a bar chart shows the top performers; sorted ascending, it shows where support is needed first.
8.3.4 Parts of a whole: stacked bars
Question: “What makes up this total?”
Use a 100% stacked bar to compare composition across groups. Use a pie or donut chart only for two or three categories with clearly different sizes (for example, sex). If people have to argue about which slice is bigger, the visual is wrong.
8.3.5 Progress against target: bars with a target line
Question: “Are we reaching the target?”
Plot % of Target as columns and add a reference line at 100% (see Exercise 8.4). Because targets in this model exist only per quarter, show progress by quarter or year, never by month (Chapter 7).
8.3.6 Geography: maps, with care
Question: “Where is performance high or low?”
Maps are useful when geography itself is the message, such as a cluster of cases. They are poor for exact comparison: it is hard to compare the size of two bubbles in different regions. Always pair a map with a sorted bar chart or table.
Three practical points:
- Power BI’s newer Azure Maps visual is generally available. Microsoft has announced that the older Bing Maps-based Map and Filled map visuals are scheduled for deprecation (no date was set as of October 2026), and Power BI Desktop offers to convert them. Azure Maps is not yet available in some regions, including China, Korea, and government clouds.
- A map needs locations it can recognise: real place names or, better, latitude and longitude. The book’s synthetic districts (“District 3”) are not real places, so they cannot be mapped. Use a bar chart for this dataset.
- Turning place names into map positions (geocoding) is done by an online service. Check your organisation’s data policy before mapping sensitive health data.
8.3.7 Exact values: tables and matrices
Tables are not a failure of design. They are essential when exact numbers matter (stock levels, reporting to donors), when data needs to be exported, or when users want to check a calculation.
Use the Matrix visual for hierarchies: users can expand from state to district to facility. Add conditional formatting so that exceptions stand out.
8.4 Use Colour Carefully, and Accessibly
Microsoft’s accessibility guidance for Power BI reports includes these points:
- Do not use colour as the only signal. Supplement it with text, icons, or line markers.
- Avoid colour combinations that many people find hard to tell apart, including red and green, green and brown, blue and purple, and green and blue.
- Contrast: text and background should have a contrast ratio of at least 4.5:1 (WCAG 2.1, success criterion 1.4.3).
- Alt text: add a short description to every visual that carries information (Format → General → Alt text; up to 250 characters).
- Markers: on line charts, turn on markers and use a different marker shape for each line.
In practice: use a neutral colour for most data and one highlight colour for exceptions, such as facilities below 80% of target. Avoid painting every value red, amber or green; it overwhelms the reader and excludes colour-blind users.
8.5 Protect Privacy: Small Numbers
Health dashboards often show counts for small areas or small groups. A very small count can identify individuals, especially when combined with other information on the page.
Many health agencies therefore suppress small cells. For example, the US Centers for Medicare & Medicaid Services (CMS) policy does not allow any cell containing a value from 1 to 10 to be displayed, or to be derivable from other figures on the page (such as a total minus the other rows, or a percentage). Thresholds differ between organisations and countries. Find out which rule applies to your data before you publish.
The book’s data shows why this matters. HIV-positive results by facility range from 0 to 6: 52 of the 60 facilities have between 1 and 10. A facility-level table of HIV-positive results would break a 1-to-10 rule in almost every row. Options include:
- report at a higher level (state instead of facility),
- combine categories (for example, broader age groups),
- show rates only where the denominator is large enough,
- suppress the value with a measure, for example:
HIV Positive (suppressed) =
VAR n = [HIV Positive]
RETURN IF ( n >= 1 && n <= 10, BLANK (), n )
Suppression in a measure is not enough on its own: totals and percentages can still reveal a suppressed value. Review the whole page.
8.6 Interaction Should Support Thinking
Interactivity is one of Power BI’s strengths, when it is deliberate:
- Cross-filtering: selecting a bar filters the other visuals on the page.
- Drill-down: with a hierarchy, users move from summary to detail (year → quarter → month; state → district → facility).
- Tooltips: extra detail on hover. Microsoft’s accessibility guidance notes that tooltips are hard to reach for keyboard and screen-reader users, so never put essential information only in a tooltip.
If selecting one visual makes another confusing, select the first visual and use Format → Edit interactions to turn off its effect on the other.
8.7 Hands-On: Building a Monitoring Page
Use the measures from Chapter 7. Leave slicers empty (all data) when checking the expected results.
8.7.1 Exercise 8.1: Status cards
- Add a Card visual. Put
Malaria Tested,Malaria Positivity RateandMalaria % of Targetin Values. - Cards abbreviate large numbers by default (7,062 appears as 7K). To show the full number, go to Format visual → Visual → Callout values → Values and set Display units to None.
Expected: 7,062; 30.6%; 89.9%.
Place the card at the top left.
8.7.2 Exercise 8.2: Trend over time
- Add a Line chart with
dim_date[month]on the X-axis andTotal Visitson the Y-axis. - Turn on line markers in the Format visual pane.
Expected: 12 points from Jan (846) to Dec (835), in calendar order. The highest month is May (878). If months are alphabetical, revisit Step 6 in Chapter 6.
8.7.3 Exercise 8.3: Ranking facilities
- Add a Clustered bar chart with
dim_facility[facility_name]andTotal Visits. - Sort by
Total Visits, descending.
Expected: Facility 2 (199) at the top. Now sort ascending: Facility 32 (127) is at the top, which is where a supervisor might start asking questions.
Then change the visual to a Pie chart and try to find Facility 32. This is why pie charts are poor for comparing many categories.
8.7.4 Exercise 8.4: Progress against target
- Add a Clustered column chart with
dim_date[quarter]andMalaria % of Target. - Select the visual, open the Analytics pane (the Analytics icon in the Visualizations pane), and add a Y-Axis constant line with the value 1 (100%). Name it Target and turn on its data label.
Expected: four columns between 89.2% and 90.5%, all below the 100% line.
8.7.5 Exercise 8.5: Detail with a matrix
- Add a Matrix with the
Locationhierarchy (state → district → facility) in Rows, andMalaria TestedandMalaria Positivity Ratein Values. - Use the expand icons on the matrix header to drill from state to district to facility.
- Add conditional formatting to
Malaria Positivity Rate: in the Values well, select the arrow next to the field → Conditional formatting → Background color, and choose a single-colour scale (light to dark) rather than red-to-green.
Expected at state level: State A 3,125 tests and 31.0%; State B 2,187 and 29.4%; State C 1,750 and 31.1%.
8.7.6 Exercise 8.6: Alt text and check
- For each visual, add alt text that states what it shows, for example: “Malaria tests as a percentage of quarterly target, by quarter, with a line at 100%.”
- Turn down your screen brightness, or step back from the screen. Can you still see the status at the top left?
8.8 Designing for Phones
Many field staff use the Power BI mobile app. You can create a phone-optimized version of each page with mobile layout view in Power BI Desktop (on the View tab), arranging only the visuals that matter on a phone. Mobile-optimized pages are shown in the Power BI mobile apps for iOS and Android when the phone is upright; in a web browser, users always see the standard page.
8.9 Avoiding Common Visualization Mistakes
- Too many visuals on one page. If it does not fit, it belongs on another page.
- Colour everywhere. Use one highlight colour for exceptions, and never colour alone.
- Pie charts for comparison. Never use a pie chart to compare 15 districts.
- Numbers without context. Show a target, a previous period, or a rate next to every headline number.
- Showing quarterly targets by month. The measure returns blank by design; use quarters.
- Small counts in public views. Apply your organisation’s suppression rule.
8.10 A Visual Selection Checklist
Before finalizing any visual, ask:
- What question does this visual answer?
- Is this the simplest visual that answers it?
- Can the message be understood in a few seconds?
- Would a sorted bar chart or a table be clearer?
- Does it work without colour, and does it have alt text?
- Could any number on it identify an individual?
When in doubt, choose clarity over creativity.
8.11 What to Carry Forward
Good dashboards are quiet. They do not impress with decoration; they communicate clearly and invite action.
When indicators are defined once as measures and visuals are chosen deliberately, dashboards become trusted tools rather than presentation artefacts.
The next chapter covers publishing and sharing dashboards responsibly, so that the right people see the right information.
Power BI for M&E and Public Health Data Analysts · The Growing Analyst